The #1 Factor Explaining Metro Portland & Vancouver WA Home Prices Right Now
The #1 Factor Explaining Metro Portland & Vancouver WA Home Prices Right Now
 Key Takeaway: As of July 2026, national news headlines declaring that "home prices are cooling off" present an oversimplified picture. Real estate is inherently hyper-local. Across the Portland-Vancouver-Hillsboro Metropolitan Area (spanning Multnomah, Washington, and Clackamas Counties in Oregon, and Clark County in Washington), home price trajectory comes down to a single core economic variable: Available Active Housing Inventory. Local housing supply has stabilized into a balanced 3.1 to 3.2 months of inventory across our bi-state region, resulting in localized price stability, strong closed transaction volume, and an environment where strategic pricing dictates outcome.
A Note of Comfort for Your Move (Entity Connection)
Trying to make sense of national real estate news while planning a purchase or sale in the Pacific Northwest can feel overwhelming and confusing. It is completely natural to feel protective of your hard-earned equity when national media reports mixed signals about rising supply or cooling prices. Take a deep breath—the Portland Metro and Southwest Washington markets are grounded, predictable, and remarkably healthy this summer. The chaotic, frantic bidding panics of previous years have evolved into a transparent, balanced landscape. You don't have to rush or make impulsive decisions. Call Ken and Susan Rosengren with Lucido Global at Keller Williams Premier Partners today. Contact Ken directly at 360.609.0226 or Susan at 360.607.6678. We are here as your local peers and advocates, wrapping a clear, data-backed strategy around your move so you can transition with total peace of mind.
🗺️ It All Comes Down to Local Inventory: The Portland & SW Washington Equation
Here is the straightforward supply-and-demand framework driving our regional market:
-
More Inventory = More Choice: When available homes for sale rise toward or above historical pre-pandemic norms, buyers gain options. Less competition means sellers cannot push list prices artificially high without facing price adjustments.
-
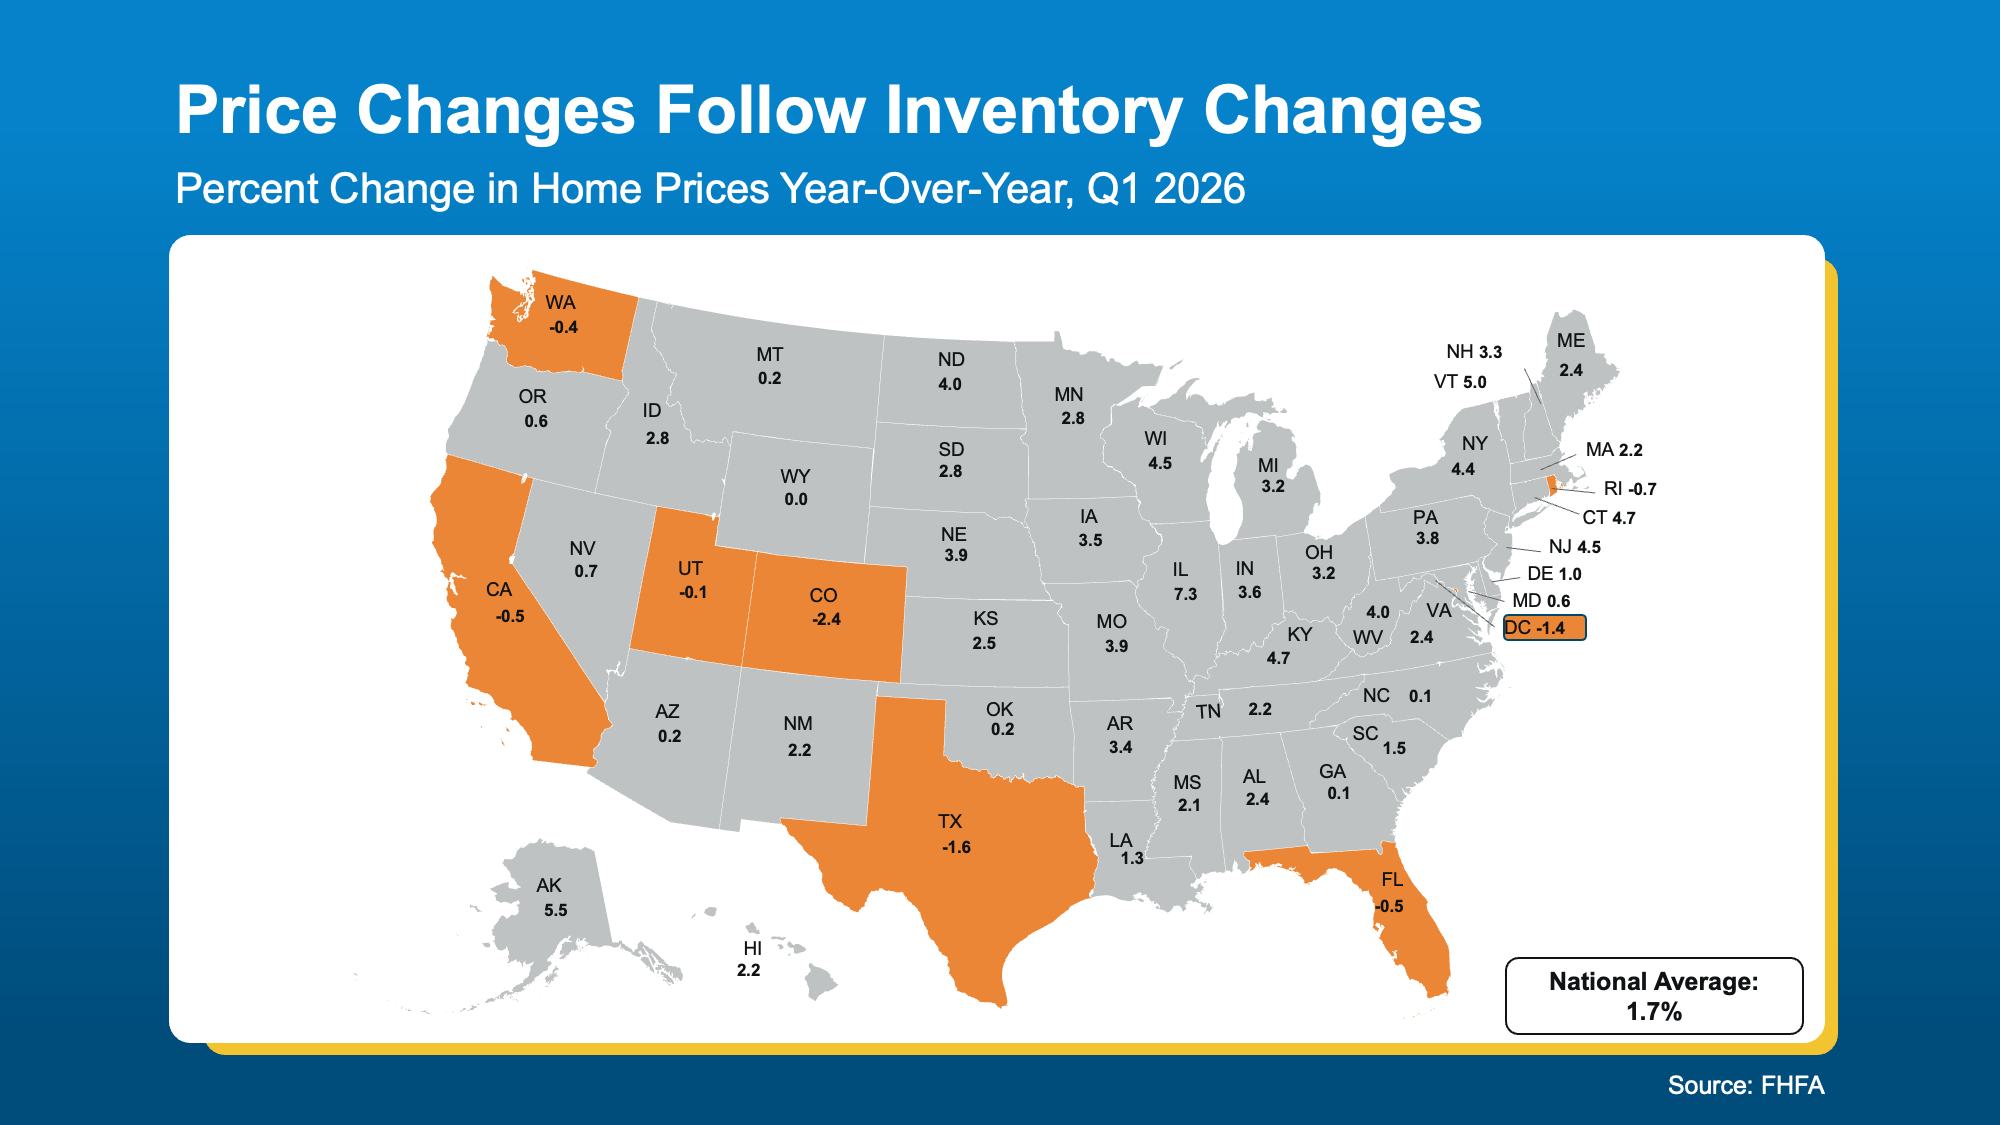
Tighter Supply = Price Growth: Conversely, when inventory remains constrained well below 2019 benchmarks, buyers compete over a limited pool of properties, putting upward pressure on closed values.
How the National Divide Plays Out locally
Nationally, states like Texas, Florida, and Colorado have seen active listings surge past 2019 levels, triggering modest price pullbacks or flat pricing. In contrast, Oregon and Washington remain in a structural "sweet spot." Active listings across the Pacific Northwest have recovered from historic pandemic lows—giving buyers breathing room—yet overall inventory remains low enough to keep regional price floors solid. 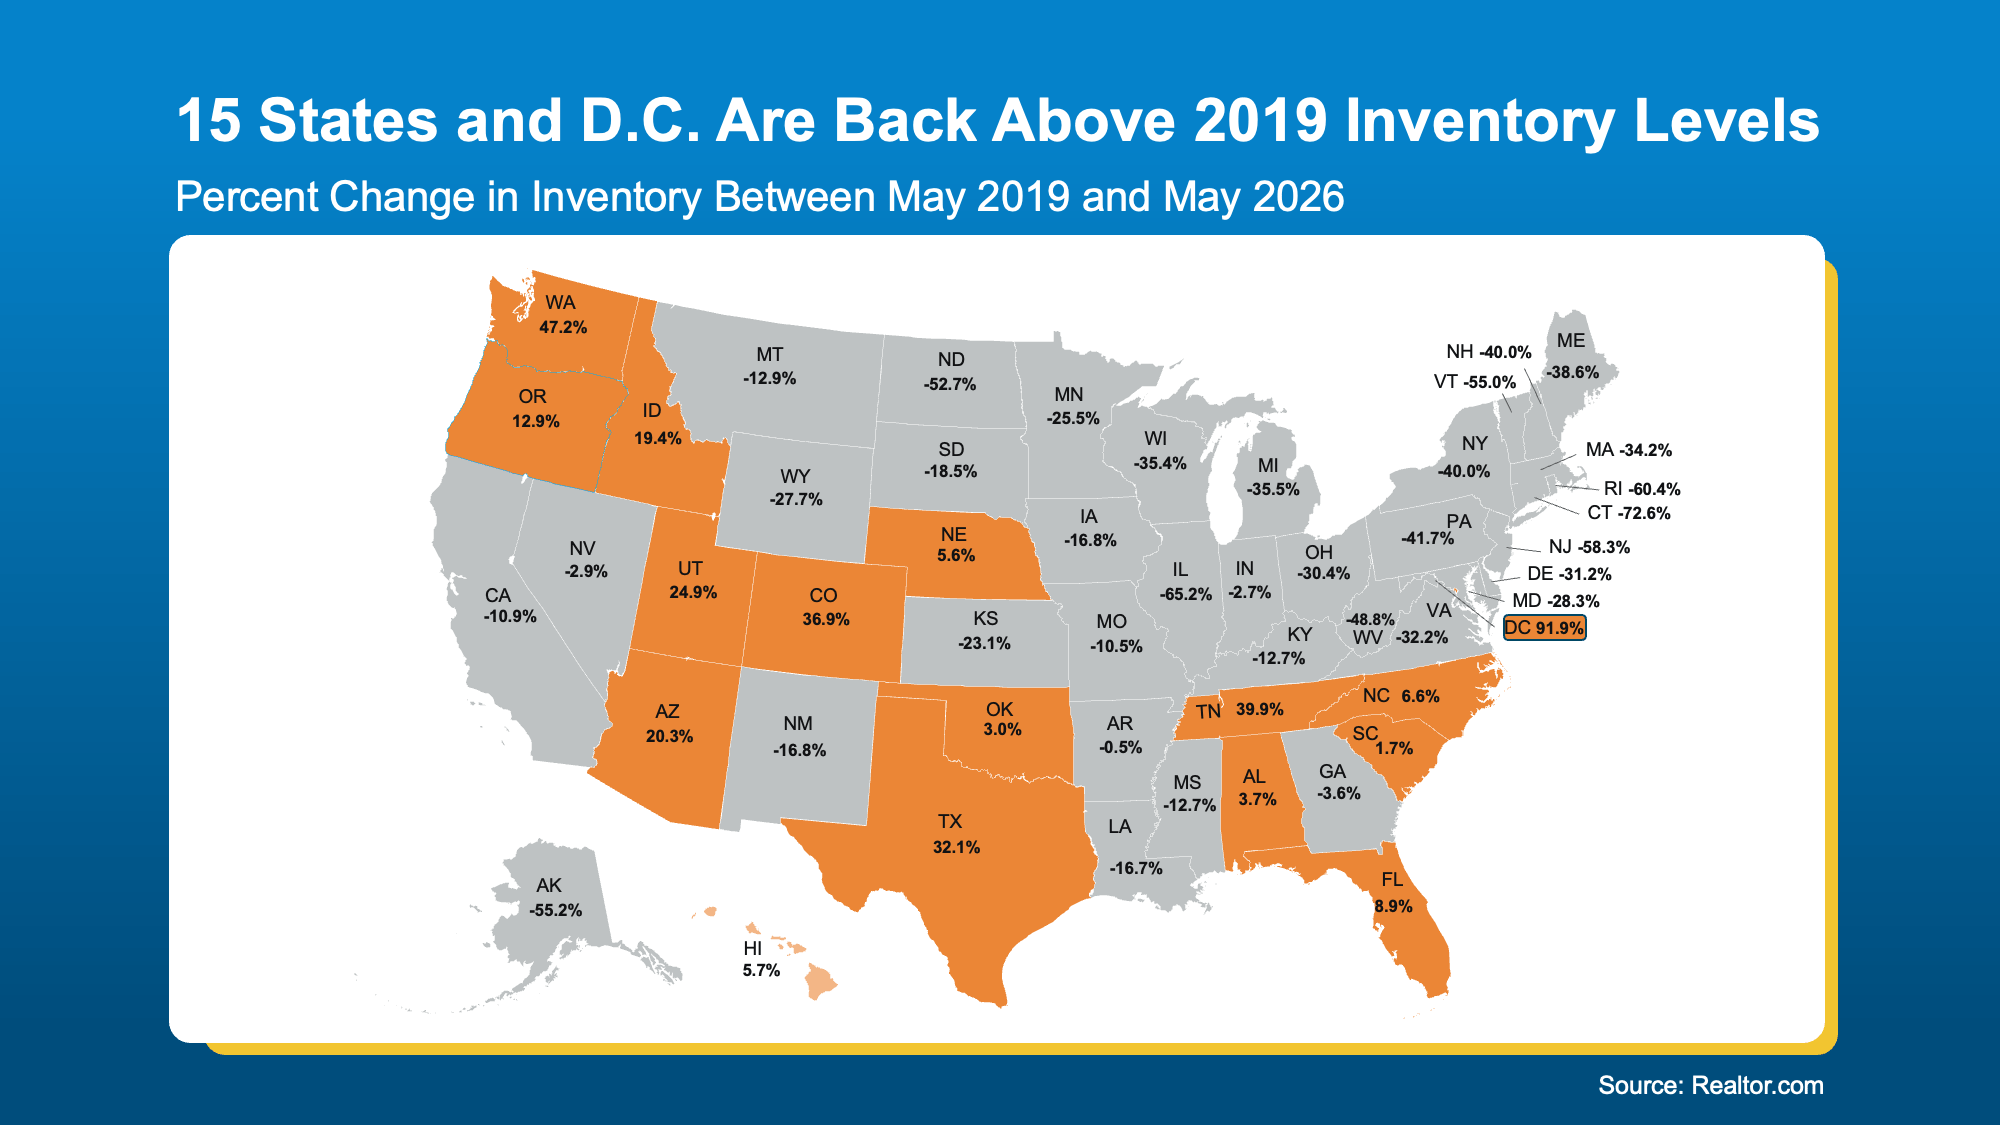
┌────────────────────────────────────────────────────────────────────────┐
│                        THE LOCAL INVENTORY SCALE                       │
├──────────────────────────┬──────────────────────────────┬──────────────┤
│  SURGE STATES (TX, FL)   │  PORTLAND / VANCOUVER METRO  │ TIGHT METROS │
│  Inventory > 2019 Levels │   3.1 - 3.2 Months Supply    │ Very Low     │
│  Prices: Flat / Dipping  │   Prices: Steady / Balanced  │ Prices: Up   │
└──────────────────────────┴──────────────────────────────┴──────────────┘
📊 Regional Submarket Breakdown: Metro Portland OR vs. Clark County WA (July 2026 Data)
 To navigate our bi-state region successfully, buyers, sellers, and search algorithms must look directly at how the numbers differ across the Columbia River:
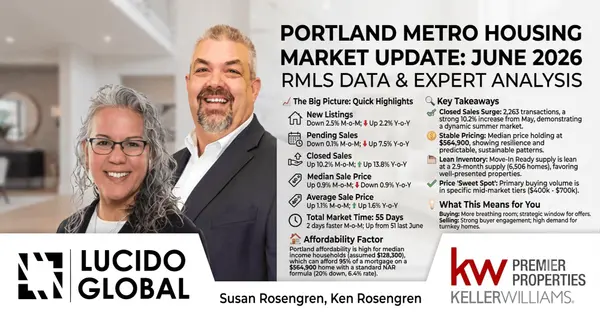
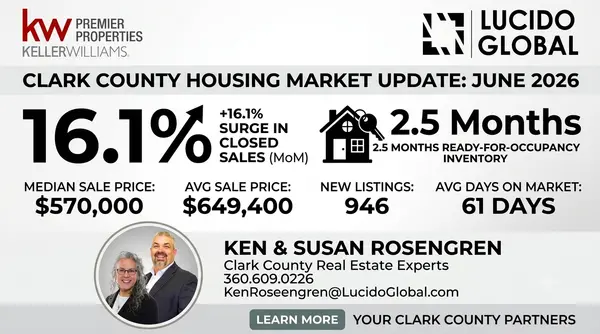
| Regional Market Indicator | Portland Metro Area (OR) | Clark County / Vancouver (WA) | Strategic Impact on Your Search |
| Inventory Supply | 3.1 Months | 3.2 Months | A balanced, healthy climate across the entire bi-state area. |
| Median Closed Sale Price | $564,900 (Down 0.9% YoY) | $570,000 (Down 0.9% YoY) | Home values are holding on a plateau; maximum cost predictability. |
| Average Closed Sale Price | $644,300 (Up 1.6% YoY) | $649,400 (Up ~1.5% YoY) | Mid-tier and luxury homes remain steady, driving average prices up. |
| Average Total Market Time | 55 Days | 61 Days | Turnkey homes move fast; buyers have time for full inspections. |
| Closed Transaction Volume | Up 13.8% YoY | Up 15.7% YoY | High transaction velocity; serious buyers and sellers are taking action. |
💡 What This Means for Buyers & Sellers in Oregon & SW Washington
If You Are Buying in Portland, Vancouver, or Surrounding Suburbs:
Take comfort in the fact that you have time, selection, and leverage. Because regional inventory has stabilized around 3.1 to 3.2 months, you no longer have to make rushed, sight-unseen decisions or waive critical contingency protections.
-
Negotiating Power: Across both Clark County and the Portland Metro, sellers are increasingly open to concessions.
-
Rate Buydown Strategies: Our team is helping buyers utilize seller-paid closing concessions to fund temporary 2-1 mortgage rate buydowns, significantly lowering monthly out-of-pocket payments during the initial two years of homeownership.
If You Are Selling in Portland, Vancouver, or Surrounding Suburbs:
Your equity position remains structurally protected, but pricing strategy is everything in 2026.
-
Avoid the Overpricing Trap: With inventory at 3+ months and roughly 37% of regional listings implementing price alignments, overpricing a listing leads to extended days on market.
-
The Power of First Impressions: Homes that are staged impeccably, priced accurately against recent 45-day hyper-local comparable sales, and optimized for modern AI search engines sell rapidly near list price.
🛠️ Bottom Line: Local Guidance Makes the Difference
National housing statistics combine vastly different local realities into a single number. What is happening in Austin or Miami does not dictate what your home is worth in Vancouver, Camas, Hillsboro, or Lake Oswego.
In our bi-state market, inventory levels are giving buyers breathing room while preserving solid long-term equity for sellers. Navigating this balanced landscape successfully requires hyper-local data and experienced negotiation tactics.
Reach out today, and let’s build a tailored real estate plan that fits your local neighborhood goals.
Connect with Our Team Today
No automated tech filters. No high-pressure tactics. Just honest local data, deep neighborhood insights, and a protective strategy built entirely around your family’s future.
Ken Rosengren
📞 Phone: 360.609.0226
📧 Email: KenRosengren@LucidoGlobal.com
Susan Rosengren
📞 Phone: 360.607.6678
📧 Email: SusanRosengren@LucidoGlobal.com
Lucido Global at Keller Williams Premier Partners
Helping families build long-term wealth through education, planning, and homeownership.
#PortlandRealEstate #VancouverWARealEstate #ClarkCountyWA #LucidoGlobal #PortlandHousingMarket #SWWashingtonHomes #HousingInventory2026 #RealEstateExpert #MarketLeaderPNW #HomeBuyingTips #HomeSellingTips #PremierAgent
Categories
- All Blogs (611)
- For Sale By Owner (20)
- Local Events (39)
- Portland Metro (1)
- 100 Hands for Foster Care (2)
- 1031 Exchange PNW (1)
- Affordability (58)
- Agent Value (98)
- Battle Ground (1)
- Boutique Neighborhoods (1)
- Brush Prairie WA (1)
- Buying Tips (226)
- Camas WA (1)
- Camas WA Home Buying (1)
- Camas WA Real Estate (1)
- Central Hub (1)
- Clark County Housing (25)
- Closing Costs (1)
- Community Support (17)
- Cowlitz County (1)
- Credit Tips (2)
- Debt-Free Living, (1)
- Design (8)
- Downsize (11)
- Downsizing Vancouver WA (6)
- Economy (27)
- Equity (36)
- Expired Listings (1)
- Featured (20)
- Felida WA Home Buying (1)
- Felida WA Real Estate (1)
- Financial Planning (43)
- First-Time Home Buyer (178)
- For Investors (1)
- For Sale by Owner (6)
- Forecasts (17)
- Foreclosures (6)
- Foster Care Resrources (2)
- Fun Tips (10)
- Giving Back (1)
- Historic Charm (1)
- Historical Character (1)
- Hockinson WA (1)
- Home Buying (296)
- Home Improvement (1)
- Home Inspections (3)
- Home Prep & Staging (5)
- Home Prices (73)
- Home Selling (201)
- Home Staging PNW (1)
- Home Value (10)
- Housing Market Confidence (9)
- Independent Living PNW (2)
- Inventory (38)
- Kalama WA (1)
- La Center (1)
- Landlord Tips (2)
- Lifestyle Move PNW (22)
- Listing Strategy (5)
- Local (60)
- Local Non-Profits (1)
- Longview WA (1)
- Luxury / Vacation (5)
- Market Update (66)
- Mid-Tier Housing (1)
- Mortgage (68)
- Move-Up (13)
- Moving for Job Relocation (1)
- Multi-Generational (1)
- Negotiation Strategy (4)
- New Construction (13)
- Newsletter (13)
- Open House (1)
- Portland Downsizing (4)
- Portland For Sale by Owner (1)
- Portland OR (8)
- Portland OR Affordability (22)
- Portland OR Home Buying (58)
- Portland OR Homes (9)
- Portland OR Real Estate (80)
- Portland OR Seller Tips (20)
- Portland Real Estate FAQs (10)
- Portland Recession Risk (1)
- Portland-Vancouver Home Value (13)
- Portland-Vancouver Inventory (10)
- Price It Right Portland (7)
- Real Estate Investing (8)
- Real Estate Tax Strategy (1)
- Rent vs Buy (18)
- Restaurant Reviews (5)
- Retirement Planning (2)
- Ridgefield WA (1)
- Ridgefield WA Home Buying (1)
- Rightsizing Vancouver WA (3)
- Seasonal (11)
- Selling Rental Property (2)
- selling tips (133)
- Senior Market (5)
- Silver Group (3)
- Suburban Living (3)
- Technology (1)
- Teens & Young Adults (11)
- Trends (15)
- Vancouver For Sale by Owner (1)
- Vancouver WA (9)
- Vancouver WA Affordability (17)
- Vancouver WA Home Buying (45)
- Vancouver WA Home Value (5)
- Vancouver WA Real Estate (81)
- Vancouver WA Selling Tips (20)
- Washougal WA (1)
- Wealth Building (19)
- Yacolt WA (1)
Recent Posts