The U.S. Foreclosure Map You Need To See
The U.S. Foreclosure Map You Need To See

Foreclosure headlines are making noise again – and they’re designed to stir up fear to get you to read them. But what the data shows is actually happening in the market tells a very different story than what you might be led to believe. So, before you jump to conclusions, it’s important to look at the full picture.
Yes, foreclosure starts are up 7% in the first six months of the year. But zooming out shows that’s nowhere near crisis levels. Here’s why.
Filings Are Still Far Below Crash Levels
Even with the recent uptick, overall foreclosure filings are still very low. In the first half of 2025, just 0.13% of homes had filed for foreclosure. That’s less than 1% of homes in this country. In fact, it’s even far less than that at under a quarter of a percent. That’s a very small fraction of all the homes out there. But like with anything else in real estate, the numbers vary by market.
Here’s the map you need to see that shows how foreclosure rates are lower than you might think, and how they differ by local area:
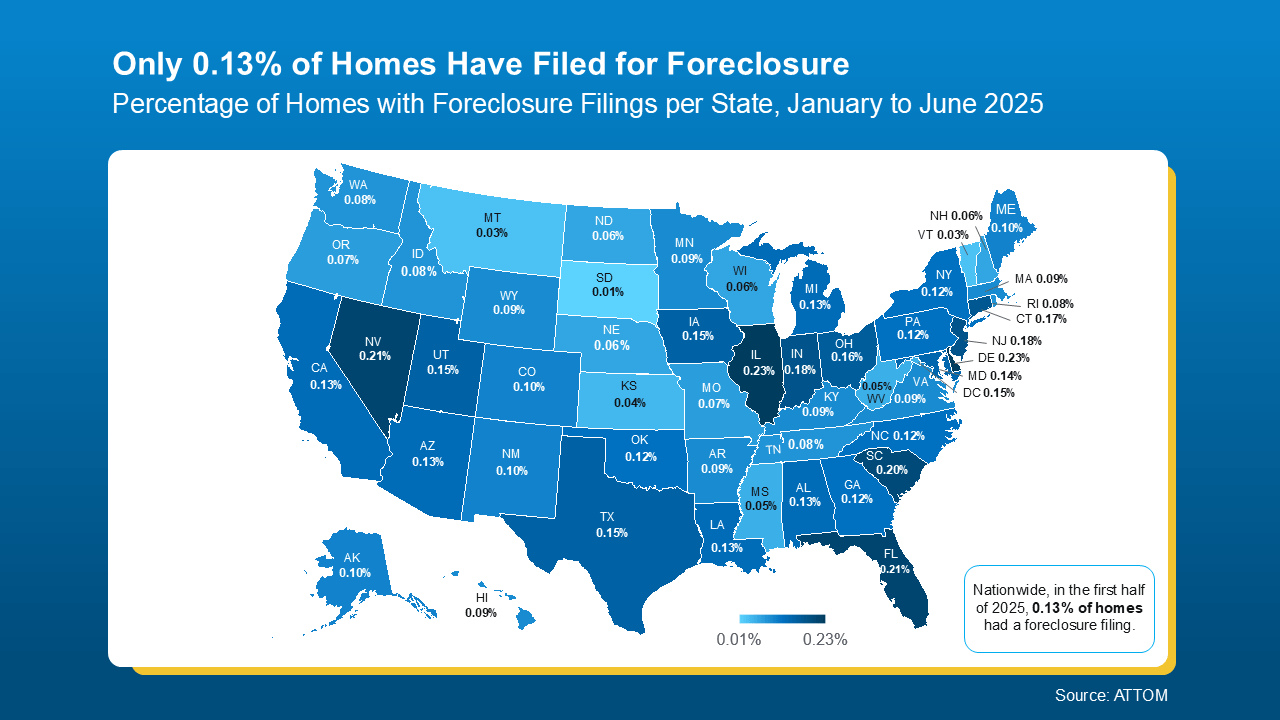 For context, data from ATTOM shows in the first half of 2025, 1 in every 758 homes nationwide had a foreclosure filing. Thats the 0.13% you can see in the map above. But in 2010, back during the crash? Mortgage News Daily says it was 1 in every 45 homes.
Today’s Numbers Don’t Indicate a Market in Trouble
But here’s what everyone remembers…
Leading up to the crash, risky lending practices left homeowners with payments they eventually couldn’t afford. That led to a situation where many homeowners were underwater on their mortgages. When they couldn’t make their payments, they had no choice but to walk away. Foreclosures surged, and the market ultimately crashed.
Today’s housing market is very different. Lending standards are stronger. Homeowners have near record levels of equity. And when someone hits financial trouble, that equity means many people can sell their home rather than face foreclosure. As Rick Sharga, Founder of CJ Patrick Company, explains:
“. . . a significant factor contributing to today’s comparatively low levels of foreclosure activity is that homeowners—including those in foreclosure—possess an unprecedented amount of home equity.”
No one wants to see a homeowner struggle. But if you’re a homeowner facing hardship, talk to your mortgage provider. You may have more options than you think.
Bottom Line
Recent headlines may not tell the whole story, but the data does. Foreclosure activity remains low by historical standards and is not a sign of another crash.
If you’re simply watching the market and want to understand what’s really going on, or how this impacts the value of your home, let’s connect. I’ll help you separate fact from fear by showing you what the data really says.
Categories
- All Blogs (608)
- For Sale By Owner (20)
- Local Events (39)
- Portland Metro (1)
- 100 Hands for Foster Care (2)
- 1031 Exchange PNW (1)
- Affordability (58)
- Agent Value (98)
- Battle Ground (1)
- Boutique Neighborhoods (1)
- Brush Prairie WA (1)
- Buying Tips (226)
- Camas WA (1)
- Camas WA Home Buying (1)
- Camas WA Real Estate (1)
- Clark County Housing (25)
- Closing Costs (1)
- Community Support (17)
- Cowlitz County (1)
- Credit Tips (2)
- Debt-Free Living, (1)
- Design (8)
- Downsize (11)
- Downsizing Vancouver WA (6)
- Economy (27)
- Equity (35)
- Expired Listings (1)
- Featured (20)
- Felida WA Home Buying (1)
- Felida WA Real Estate (1)
- Financial Planning (43)
- First-Time Home Buyer (178)
- For Investors (1)
- For Sale by Owner (6)
- Forecasts (17)
- Foreclosures (6)
- Foster Care Resrources (2)
- Fun Tips (10)
- Giving Back (1)
- Historic Charm (1)
- Historical Character (1)
- Hockinson WA (1)
- Home Buying (295)
- Home Improvement (1)
- Home Inspections (3)
- Home Prep & Staging (5)
- Home Prices (73)
- Home Selling (200)
- Home Staging PNW (1)
- Home Value (10)
- Housing Market Confidence (7)
- Independent Living PNW (2)
- Inventory (38)
- Kalama WA (1)
- La Center (1)
- Landlord Tips (2)
- Lifestyle Move PNW (22)
- Listing Strategy (5)
- Local (57)
- Local Non-Profits (1)
- Longview WA (1)
- Luxury / Vacation (5)
- Market Update (66)
- Mid-Tier Housing (1)
- Mortgage (68)
- Move-Up (13)
- Moving for Job Relocation (1)
- Multi-Generational (1)
- Negotiation Strategy (4)
- New Construction (13)
- Newsletter (13)
- Open House (1)
- Portland Downsizing (4)
- Portland For Sale by Owner (1)
- Portland OR (8)
- Portland OR Affordability (22)
- Portland OR Home Buying (57)
- Portland OR Homes (9)
- Portland OR Real Estate (77)
- Portland OR Seller Tips (20)
- Portland Real Estate FAQs (10)
- Portland Recession Risk (1)
- Portland-Vancouver Home Value (13)
- Portland-Vancouver Inventory (10)
- Price It Right Portland (7)
- Real Estate Investing (8)
- Real Estate Tax Strategy (1)
- Rent vs Buy (18)
- Restaurant Reviews (5)
- Retirement Planning (2)
- Ridgefield WA (1)
- Ridgefield WA Home Buying (1)
- Rightsizing Vancouver WA (3)
- Seasonal (11)
- Selling Rental Property (2)
- selling tips (133)
- Senior Market (5)
- Silver Group (3)
- Suburban Living (2)
- Technology (1)
- Teens & Young Adults (11)
- Trends (15)
- Vancouver For Sale by Owner (1)
- Vancouver WA (9)
- Vancouver WA Affordability (17)
- Vancouver WA Home Buying (45)
- Vancouver WA Home Value (5)
- Vancouver WA Real Estate (79)
- Vancouver WA Selling Tips (20)
- Washougal WA (1)
- Wealth Building (18)
- Yacolt WA (1)
Recent Posts